Research · v1.0
Does a higher click-through rate mean a cheaper conversation?
A retrospective audit of selected Malaysian-targeted Meta advertising: WhatsApp ads from the accounts of ALIQ Studio's clients, January to October 2026.
 Yik Jinn, Head of SEO and AI Search, ALIQ Studio
 Reviewed by Ricky Wong, Co-founder and CEO
- Publisher
- ALIQ Studio
- Published
- Updated
- Version
- 1.0
- Licence
- CC BY 4.0
In brief
- When two WhatsApp ads ran in the same ad set in the same week, the ad with the higher link click-through rate (CTR) also had the cheaper reported conversation in 41 of 61 comparisons (67%).
- Counting each pair of ads only once, at its first week, it was 17 of 30 (57%): too close to a coin flip to say that CTR helped.
- The size of the gap is what mattered. When one ad's CTR was less than 1.5 times the other's, it was the cheaper one about half the time (15 of 29). At 1.5 times or more, it was cheaper 26 times out of 32. That is about what the arithmetic predicts on its own, because CTR is one part of the cost per conversation.
- Weekly cost differences are often fragile. The median ad had 5.5 reported conversations in a compared week, and 12 of the 20 cases where CTR and cost disagreed would flip with one conversation more or less.
- What this does not show: whether switching to the higher-CTR ad saves money in later weeks, lead quality, sales, or anything about Malaysian advertisers in general. The data are a selected set of client ads, and the outcome is Meta's reported conversation count.
Abstract
Purpose. To examine whether higher link click-through rate (CTR) identifies lower cost per reported messaging conversation within matched ad pairs, how large and how fragile the recorded differences are, and whether the answer depends on the size of the CTR gap.
Method. We analysed matched ad-pair/weeks from 5 January–30 August and 31 August–25 October 2026 in a selected Malaysian-targeted WhatsApp archive. Each ad required at least three shared delivery dates, RM30 spend and 1,000 impressions. The retrospective protocols were not externally preregistered. Magnitude, one-unit sensitivity, following-week and longer-window analyses were specified after the first results were known. We add intervals that resample whole ad pairs or owner groups and, post hoc, split comparisons by the ratio of the two ads' CTRs.
Results. Higher CTR coincided with lower recorded conversation cost in 41/61 rankable comparisons (67.2%); resampling whole ad pairs gave a 95% interval of 52.3–79.2%. Keeping each distinct pair's earliest rankable week gave 17/30 (56.7%; exact 95% interval 37.4–74.5% if the pairs were independent), which cannot be distinguished from a coin flip. The equal-pair mean was 59.5%. Adding or removing one recorded conversation could reverse 12 of the 20 disagreements. In an exploratory post-hoc split, agreement was 15/29 (51.7%) when the higher CTR was less than 1.5 times its alternative and 26/32 (81.3%) at 1.5 times or more, in both study periods. A permutation check showed that this pattern is about what the arithmetic linking CTR to cost predicts on its own. Among 58 finite comparisons, the higher-CTR ad cost at least 1.25 times its alternative in 10 and the lower-CTR ad cost at least 1.25 times the higher-CTR ad in 34. Seven following-week comparisons distinguished CTR-based from cost-based selection: the CTR choice was cheaper in four and the cost choice in three.
Conclusion. In this archive, comparing ads within the same week, higher CTR was a poor guide to the cheaper reported conversation when the two ads' CTRs were close, and a better one when the gap was large. That is what one would expect if CTR were simply one factor of cost and the other factors varied independently of it. Many cost orders rest on very few recorded events: the median was 5.5 per ad-week. The CTR-gap pattern is exploratory, and a test on later data was fixed before that data was read. The archive does not establish national rates, causal savings, lead quality or a superior selection strategy.
Keywords: advertising measurement; messaging outcomes; ranking agreement; WhatsApp; Malaysia; secondary data analysis; sensitivity analysis; cluster bootstrap
1. The research question and its practical value
The question is specific: when two messaging ads run within the same ad set on the same dates, does the ad with the higher link CTR also have the lower cost per reported messaging conversation? We examine observed agreement in a selected archive, then ask how large the recorded cost differences are, how sensitive their order is to one recorded action, whether the size of the CTR gap matters, and what the immediately following week shows. These questions retain the original primary comparison and add explicitly exploratory diagnostics, rather than testing a campaign intervention (ALIQ Studio, 2026a; 2026b; 2026c).
Link click-through rate (CTR) describes recorded link clicks relative to impressions. Conversation cost describes spend relative to the study's named reported messaging action. Their numerators and denominators differ: recorded link-click frequency and the cost of a reported messaging action are distinct quantities in this study. A higher CTR therefore needs an empirical comparison with the outcome-cost order, rather than being accepted as its definition. Neither quantity measures verified enquiry quality, bookings, unique customers or profit in the available records (ALIQ Studio, 2026b). This distinction makes the question relevant to advertisers purchasing messaging outcomes while keeping the intended outcome narrower than business value.
The two quantities are not independent either. Cost per reported conversation can be written as impression cost divided by CTR and by the ratio of reported conversations to link clicks (Section 5). CTR is one factor of the outcome, so some agreement is expected from the arithmetic alone. The useful question is how often the other two factors overturn it.
The closest commercial antecedents already examine clicks and conversion costs. Biddyco (2026b) reports a near-zero median within-brand correlation between link CTR and purchase cost in selected US advertising records; its separate high-versus-low CTR comparison uses purchase-or-lead cost. Its related analysis separates impression cost, CTR and a post-click ratio in descriptive cost comparisons (Biddyco, 2026a). These reports motivate the question and the arithmetic used here; their selected high-spend records, mixed outcomes and within-brand associations differ from shared-date WhatsApp pair/weeks. A correlation in that sample cannot supply our agreement frequency. Nor does the word "predicts" in the related report's title establish an independently tested future selection policy.
Benchmark reports also define different comparison populations. Marino (2026) separates US traffic and lead-objective campaign benchmarks, rather than pooling their objectives and measures into one performance target. ALIQ's earlier Malaysian conversation-cost report describes cost levels in another selected population with different inclusion and destination rules (Ooi, 2026). That report provides local background, with common custody and commercial interests, rather than independent corroboration or a directly comparable update population. The present question concerns which of two eligible ads had the cheaper reported outcome, rather than whether its cost exceeded a cross-campaign median.
Malaysian commercial near-work is also relevant. Lee (2026) juxtaposes CTR and WhatsApp conversation-cost indices across creative groups. This is an antecedent to local discussion of the two measures, although grouped median indices and bundled creative packaging answer a different question from our fixed shared-date pair/week comparison. Our contribution does not depend on asserting that no other Malaysian agency has examined clicks and conversations. It lies in making the retained comparison units, denominator changes, magnitude distribution, uncertainty and diagnostic restrictions explicit for this archive.
Academic work points the same way. The published abstract of Dalessandro et al. (2015) contrasts click-based and brand-site-visit proxies for purchase prediction in display campaigns. Neundorf and Öztürk (2023) find that higher traffic CTR in several survey-recruitment settings did not imply cheaper completed surveys. The latter compares campaign objectives and measures survey completion, rather than same-objective WhatsApp creative pairs. Together these sources motivate precise outcome definitions; they do not establish the size or direction of this archive's cost-order agreement.
The published abstract of Yang and Ghose (2010) reports higher aggregate click-through rates, conversion rates and revenues when paid and organic search listings appeared jointly. Hotkar, Garg and Sussman (2023) report social-ad sequencing settings with favourable engagement and downstream proxy patterns; the consumer-goods downstream measure is Amazon product rank, rather than observed purchases. These settings prevent a universal claim that clicks and outcomes cannot align. They also differ from a rule for selecting between messaging creatives, so favourable co-movement cannot by itself validate that rule here.
Ghose and Yang (2009) distinguish click/conversion indicators and advertiser profit in their published search-ad abstract. The published abstract of Lewis and Reiley (2014) places most estimated retail purchase response beyond customers who clicked. Our archive supplies no equivalent purchase or profit outcome. The study therefore contributes a bounded descriptive audit of reported messaging efficiency, with contrary evidence retained. The next section distinguishes that estimand from causal advertising effects and prospective optimisation.
2. What this design can establish
Matching ads within an ad set and on identical dates makes their recorded timing and saved grouping fields more comparable. It does not randomly assign audiences, offers, spend or exposure. Ads can reach different people and receive different delivery despite sharing those fields, while object snapshots may miss historical changes. The protocols therefore define an observational ranking comparison conditional on the retained records, rather than an experiment in raising CTR (ALIQ Studio, 2026b). This boundary remains in place even when the two recorded rates move together.
The published abstract of Gordon et al. (2019) reports divergence between observational and randomised advertising-effect estimates. Its implication here is that matching and adjustment alone do not license a causal interpretation. Nor does that caution imply that a descriptive count of agreement is necessarily incorrect: estimating an advertising effect and reporting an observed cost order are different tasks.
Lewis and Rao (2015) document difficult precision in advertising-return estimation, including problems that remain at substantial scale. The inspected published sections provide context for restraint about uncertainty, rather than an error margin for reported conversation cost. Repeated observations help only under appropriate response and dependence assumptions; their mere number cannot determine the information in this selected archive. No confidence interval, minimum action requirement or universal waiting period is borrowed from those experiments.
The published abstract of Schwartz, Bradlow and Fader (2017) distinguishes a live display-ad allocation experiment from a counterfactual click-versus-conversion optimisation comparison. The reported disadvantage of simulated click optimisation is contextual evidence about that setting, rather than a randomised WhatsApp switching-policy effect. Here, a rule can only be compared where both alternatives remain observable with sufficient following-week exposure. The records do not reveal the missing outcome an unobserved alternative would have produced (ALIQ Studio, 2026b).
We consequently report observed ranking agreement, its uncertainty under resampling of whole clusters, finite recorded gaps, deterministic sensitivity and selected later persistence. The later-period study was designed after the original result was known, and the repetition, arithmetic, reconciliation, time-window and final-stage additions (Section 3.5) are explicitly post hoc (ALIQ Studio, 2026a; 2026b; 2026c). Similar period percentages cannot establish transportability, and an arithmetic decomposition cannot establish a behavioural mechanism. These limits make the exact eligibility, zero-result convention and changing denominators central to interpretation. Section 3 specifies those rules before the results are presented.
3. Data, measures and comparison rules
3.1 Source and scope
The original analysis uses Meta Marketing application programming interface (API) v26.0 extracts saved on 24 September 2026. A read-only extension on 5 November collected the later-period history and current object snapshots. Some records were inaccessible or could not be matched to objects and were excluded. The available data is a selected archive of business advertising, not a representative sample of Malaysian advertisers or a verified national population of small and medium-sized enterprises (SMEs) (ALIQ Studio, 2026a).
The primary analysis includes records in Malaysian ringgit (MYR) with the REPLIES optimisation goal, a known client-associated identity, saved Malaysian targeting and a saved WhatsApp-only destination. Identified recruitment ads and unmatched records are excluded. Client association does not establish that ALIQ managed every historical campaign (ALIQ Studio, 2026b). Historical SME size criteria were not verified (ALIQ Studio, 2026a).
Daily-record selection flow
Each cell reports daily records retained, with exclusions at that stage in parentheses. Stages are sequential; recruitment exclusions follow object matching. These are record counts, not counts of businesses, accounts or owners.
| Daily-record stage | Original extract: retained (excluded) | Later-period extract: retained (excluded) |
|---|---|---|
| Available daily records in the extract | 7,762 | 2,841 |
| Inside the specified complete-week period | 5,919 (−1,843) | 2,841 (−0) |
MYR and REPLIES optimisation | 4,663 (−1,256) | 2,241 (−600) |
| Known client-associated identity | 4,307 (−356) | 2,102 (−139) |
| Matched ad, ad-set and campaign objects | 4,307 (−0) | 2,030 (−72) |
| Not identified as recruitment | 4,144 (−163) | 1,882 (−148) |
| Saved WhatsApp-only destination | 3,370 (−774) | 1,515 (−367) |
| Saved targeting restricted to Malaysia | 3,370 (−0) | 1,515 (−0) |
| Returned actions list; eligible daily records | 2,896 (−474) | 1,273 (−242) |
Source: saved daily-record flow counters (ALIQ Studio, 2026a). The original extract covers observed dates from 1 January–23 September 2026, whereas the later-period extract covers 31 August–25 October 2026. Their source dates overlap, so the available-extract counts must not be added. The analysis windows, 5 January–30 August and 31 August–25 October 2026, are disjoint (ALIQ Studio, 2026b).
3.2 Measures
Measures are calculated from totals over the dates shared by both ads. Cost per mille (CPM) expresses cost per 1,000 impressions:
| Measure | Operational definition |
|---|---|
| Link CTR (%) | 100 × recorded inline_link_clicks ÷ impressions |
| CPM (RM) | 1,000 × spend ÷ impressions |
| Reported conversations | Sum of returned value for onsite_conversion.messaging_conversation_started_7d only |
| Cost per reported conversation (RM) | Spend ÷ reported conversations, where the denominator is positive |
Source: study protocol (ALIQ Studio, 2026b). Daily CTRs are not averaged.
The conversation measure is a platform-reported action count. It is not a verified count of unique people, new customers, qualified enquiries or sales. Meta's Business Help Centre, read on 8 November 2026, defines messaging conversations started as "the number of times that a messaging conversation was started with your business after at least seven days of inactivity, attributed to your ads". It adds that for WhatsApp Business "this metric only includes conversations started from clicks on your ad" (Meta, 2026a). The 7d in the API action name therefore most plausibly refers to this seven-day inactivity rule rather than an attribution window. A person who messaged the business within the previous seven days is not counted again. Ads are still matched on the separately returned attribution_setting (ALIQ Studio, 2026b). The help page gives today's wording; it does not prove the definition in force on every historical date, the exact semantics of the API field, or how missing values are handled.
Meta defines link clicks as "clicks on links within the ad that led to advertiser-specified destinations, on or off Meta technologies", where those destinations "are based on your campaign, ad set and ad settings" (Meta, 2026b). The page does not say whether the tap that opens WhatsApp counts as a link click, and we do not assume it either way.
Pinned capture metadata record API v26.0, report level ad and daily time_increment=1 in both periods. They do not record action_attribution_windows, action_report_time, use_account_attribution_setting or use_unified_attribution_setting. No runtime default or attribution policy is inferred from those omissions. Requested fields are not a guarantee that every field was returned. Exact returned attribution_setting structures were used for grouping; their values remain restricted. The recorded settings are documented in the methods summary.
In the primary analysis, an entirely missing or non-list actions field is unknown and excluded. If an action list is returned but the named conversation action is absent, that row contributes zero recorded events under the disclosed summation convention. Absence does not prove a true event count of zero (ALIQ Studio, 2026b). These are rules for summing returned records, rather than assertions about unseen people or messages. Section 6 tests the reporting consistency and sensitivity of this convention.
3.3 Matching and ranking
Ads are paired within the same account, ad set, calendar week, objective, returned attribution setting and saved destination. Only dates on which both ads recorded positive impressions contribute to the pair. Each side must have at least three such dates, RM30 spend and 1,000 impressions. There is no minimum conversation count in the primary analysis (ALIQ Studio, 2026b).
Daily rows require matching saved date_start and date_stop labels; date_start is retained unchanged for endpoint filtering and shared-date matching. Weekly grouping parses the saved label as a date and subtracts its weekday offset to assign Monday. No analytical timezone conversion is applied. The implementation does not establish the provider's underlying timezone.
The three-date, RM30 and 1,000-impression floors are analyst-selected exposure screens defining the selected comparison population. They limit extremely brief or low-exposure comparisons; no empirical optimal-cutoff calibration, minimum precision, reliability guarantee or power justification is documented. The lower- and higher-floor checks describe sensitivity to these choices rather than deriving or validating an optimum (ALIQ Studio, 2026a; 2026b).
CTR and cost rankings use exact cross-products rather than rounded displayed rates. Exact ties are separated. If both ads have no recorded conversations, the pair cannot be ranked by conversation cost. If only one has none, it ranks behind the positive-result alternative; its cost is undefined rather than RM0 (ALIQ Studio, 2026b).
The unit is an ad-pair/week comparison. Pairs, ads and owner groups can recur (ALIQ Studio, 2026a). The denominator is not a count of independent trials, businesses or customers. Shared-member dependence can persist even without a repeated identical pair (Aronow, Samii and Assenova, 2015). The original protocol therefore ruled out a binomial confidence interval built on the pair/week count. We add intervals that resample whole ad pairs or whole owner groups instead (Section 3.5). They are a labelled deviation from the protocol, not population error margins or national estimates.
Ad-pair/week selection flow
Candidate unordered pairs are enumerated within the matching groups only after the daily-record restrictions. Each cell reports pair/week comparisons retained, with exclusions at that stage in parentheses.
| Pair/week stage | Original period: retained (excluded) | Later period: retained (excluded) |
|---|---|---|
| Candidate unordered pairs within matching groups | 483 | 181 |
| At least three shared dates with positive impressions | 204 (−279) | 84 (−97) |
| Qualifying: each ad meets RM30 spend and 1,000 impressions on shared dates | 43 (−161) | 20 (−64) |
| At least one ad has recorded conversations | 41 (−2) | 20 (−0) |
| No exact CTR or conversation-cost tie; rankable comparisons | 41 (−0) | 20 (−0) |
Source: saved primary results and enumeration of eligible daily records (ALIQ Studio, 2026a). Eligible daily records need not contribute to any qualifying pair, and several pairs can reuse a record. The daily-record and pair/week flows therefore use different units.
The exposure floor removes most candidates: 161 of 204 original-period pairs with three shared dates failed it. Ads in one ad set compete for the same delivery, so a pair in which one ad received little spend is excluded. The retained comparisons are therefore pairs in which both ads kept receiving delivery, which is a selected population.
3.4 Exploratory magnitude and stability analyses
The magnitude, one-unit, following-week and longer-window additions in Sections 4.3–4.4 and 7.1–7.3 were specified after the prior findings were known and frozen before calculating these extension outcomes. The final-stage additions are described separately in Section 3.5. They reuse the retained records, original matching dimensions, period-specific eligibility and missing-action conventions. Detailed specifications and reproduction records are retained with the study documentation (ALIQ Studio, 2026b).
Let H denote the higher-CTR ad and L its alternative. With positive reported conversation counts on both sides, the finite cost ratio is (spend H ÷ conversations H) ÷ (spend L ÷ conversations L). Zero-count cases remain separate. For thresholds t of 1.10, 1.25, 1.50 and 2.00, H/L ≥ t and H/L ≤ 1/t define the two directions; equality enters the outer bands. Finite cost ties enter the central band. Quantiles use linear interpolation at (n−1)p. These illustrative thresholds do not define statistical significance or profitability (ALIQ Studio, 2026b).
For each baseline rankable comparison, we hold spend, impressions and CTR orientation fixed and separately evaluate H+1, L+1, H−1 and L−1 units of the named reported action. Removal requires at least one unit on that side, preserving any fractional original value. Exact cross-products identify reversal, tie or a both-zero outcome. Their comparison-level union counts each comparison once, irrespective of overlapping scenario flags. The denominator counts baseline comparisons, not scenarios. This deterministic arithmetic check estimates neither uncertainty nor an error or reversal probability (ALIQ Studio, 2026b).
Follow-up uses the immediately next calendar week without skipping missing weeks, keeps H fixed as the training higher-CTR ad, and requires the original exact matching dimensions and exposure floors. Pooling the disjoint source windows permits the August-boundary transition only when those dimensions match. A separate nonoverlap subset is selected before checking follow-up availability or outcomes: candidates with a following week inside the combined interval are ordered by training week, canonical account/ad-pair key and settings key. Greedy selection reserves both weeks for that account/ad pair across settings groups. Failed candidates retain their reservations and are not replaced (ALIQ Studio, 2026b).
Two- and four-week blocks are anchored to Monday 5 January 2026 and must be complete within 5 January–25 October. These blocks use the same unchanged daily labels and calendar convention as the weekly analysis. Shared-date requirements scale to six days/RM60/2,000 impressions and twelve days/RM120/4,000 impressions per ad. We also restrict to the original 30-pair universe, defined by account and unordered ad identifiers. Earliest-rankable selection is made once across both periods; subsets requiring five or ten reported conversations per ad are explicitly selected on outcomes (ALIQ Studio, 2026b).
3.5 Analyses added at the final stage
Three analyses, and a benchmark described at the end of this section, were added at the final stage. The three were written into a specification on 8 November 2026, after preliminary versions of them had already been run, and the code was frozen before the final run (ALIQ Studio, 2026c). They are post hoc and exploratory. A second calculation path, written separately, re-enumerated every candidate pair from the retained eligible daily records, recovered exactly the 63 qualifying comparisons and their dates, rebuilt each side's totals, and reproduced the counts in Sections 4.4 (robust and fragile agreement), 4.5 and 4.6. The other rows of Tables 2 and 4 come from the earlier retained results, which had their own separate calculation checks.
Clustered uncertainty intervals. A percentile bootstrap with 20,000 replicates resamples whole clusters with replacement and recomputes pooled agreement. One version resamples distinct ad pairs; another resamples owner groups. For the earliest-per-pair view, which has one observation per pair, we report the owner-clustered interval and an exact Clopper–Pearson interval and binomial test that treat the 30 pairs as independent. Both readings ignore some dependence: shared ads and owners link different pairs. With few owner groups, percentile bootstrap intervals are likely to be too narrow.
Agreement by size of the CTR gap. For each comparison, the CTR ratio is H's link CTR divided by L's, computed exactly; it exceeds 1 by construction. The first exploratory run grouped the ratios into three bands with boundaries at 1.2 and 1.5, round numbers chosen before any CTR-gap result had been seen but after all the study's other results were known. Making 1.5 the single lead cut-point was decided after that run. We also report the median split, quartile bands, cut-points of 1.3, 1.4, 1.75 and 2.0, each period separately, the earliest-per-pair view, and clustered intervals for the difference in agreement. This split conditions on the predictor, not on the cost outcome.
Agreement among one-unit-robust and one-unit-fragile comparisons. A comparison is fragile if any admissible one-unit scenario in Section 3.4 changes its strict cost order. This split conditions on the outcome and is descriptive only.
An arithmetic benchmark for the CTR-gap split. Added after a separate review of this version asked how much of the split arithmetic alone explains. By the identity in Section 5, the higher-CTR ad is cheaper exactly when Q = (CPM H/L) × (R L/H) is smaller than the CTR ratio. The benchmark keeps every finite comparison's CTR ratio and shuffles Q across comparisons, within each period, 20,000 times with a fixed seed. This breaks any link between the size of the CTR gap and the other two factors. A second version shuffles across both periods. The three comparisons with zero recorded conversations on one side have no finite Q and are left out.
The number of client businesses, their identities and their individual contributions remain restricted.
4. Results: agreement appeared in both periods
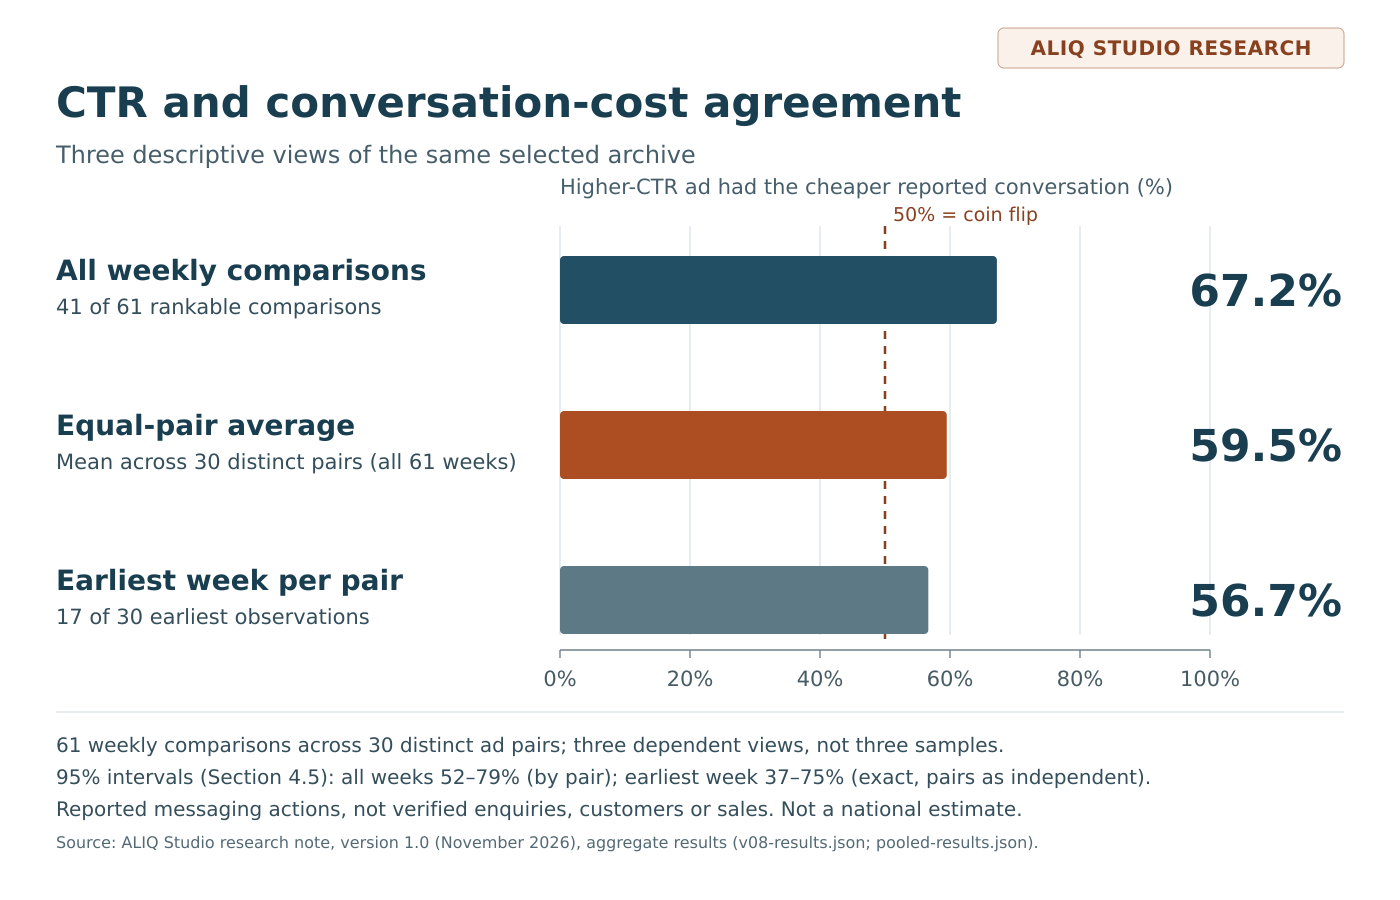
Figure 1. Three descriptive agreement summaries in the selected Malaysian-targeted WhatsApp archive. Agreement was 41/61 (67.2%) across all rankable pair/week comparisons, 59.5% when each distinct pair received equal weight across its rankable observations, and 17/30 (56.7%) when only each pair's earliest rankable observation was retained. These are differently weighted descriptions of the same selected archive, not independent trials, national estimates or new-ad accuracy. The dashed line marks 50%. Comparisons require at least three shared delivery dates, RM30 spend and 1,000 impressions per ad. The outcome is a platform-reported messaging action, not verified enquiries, unique customers or sales. Uncertainty intervals are in Section 4.5. Sources: ALIQ Studio (2026a; 2026c); pooled results.
| Analysis | Study window | Agreement | Disagreement |
|---|---|---|---|
| Original archive | 5 January–30 August 2026 | 27/41 (65.9%) | 14/41 (34.1%) |
| Later-period replication | 31 August–25 October 2026 | 14/20 (70.0%) | 6/20 (30.0%) |
| Combined descriptive total | Both periods | 41/61 (67.2%) | 20/61 (32.8%) |
Source: ALIQ Studio (2026a), original and later-period primary results and combined summary. Repeated comparisons are dependent.
Two further original-period pair/weeks recorded no conversations for either ad and are excluded from Table 1's denominator. Among the 61 rankable comparisons, three had no recorded conversations on one side only: two on the lower-CTR side, which count as agreement, and one on the higher-CTR side, which counts as disagreement (ALIQ Studio, 2026a; 2026c).
The similar raw percentages across periods provide a second descriptive view. They do not establish a stable population rate or a trend: access, included records and object snapshot dates differed (ALIQ Studio, 2026a). Agreement in Table 1 is defined over non-tied, directionally rankable comparisons under the stated convention, so it should not be read as a success rate across all delivered ads. The repetition and weighting checks below examine how the retained comparison units affect the description.
4.1 Repetition changes the apparent strength
The combined result includes 61 observations of 30 distinct ad pairs. As a post-hoc diagnostic, we retained only the earliest rankable week for each distinct pair across both periods. Agreement fell to 17/30 (56.7%), with 13 disagreements (43.3%). The rule was specified before this diagnostic was calculated but after the primary result was known (ALIQ Studio, 2026a; 2026b).
Removing the first rankable observation of each pair from the combined primary cohort leaves 24/31 (77.4%) agreement among the remaining repeated observations. This is a descriptive partition of the existing counts, not an independent replication. It does not show that repetition causes higher agreement or that later observations improve forecasting. Section 4.4 shows that the two halves also differ sharply in how much evidence each comparison rests on.
A further exploratory diagnostic, specified on 6 November 2026 after the primary and earliest-pair findings were known, gives each of the 30 distinct ad pairs equal weight while retaining all 61 rankable pair/week observations. It averages each pair's proportion of agreeing weeks, using exact rational arithmetic before rounding the final percentage to one decimal; the equal-pair agreement is 59.5%. This is descriptively closer to the earliest-pair 56.7% than the all-week 67.2%, but the weighting schemes answer different historical questions. Equal-pair weighting does not remove dependence between pairs sharing an ad, ad set or owner, establish new-ad accuracy, or validate a future selection policy.
This changes the question from "what happened across the eligible pair/weeks?" to "what happened at the first rankable observation of each pair?" Neither answers how a random Malaysian advertiser would perform (ALIQ Studio, 2026a). Distinct pairs can share an ad, an ad set or an owner, so this restriction does not create independent observations. Methods work on dyadic and clustered data explains why removing identical-pair repeats need not remove shared-member dependence (Aronow, Samii and Assenova, 2015; Cameron and Miller, 2015).
Owner groups use the approved account-to-entity associations resolved at the relevant identity date. Accounts assigned to the same entity are grouped together, and the documented common-owner association is merged across entity labels. For each represented owner group, the numerator is its agreeing rankable comparisons and the denominator is all its rankable comparisons. Groups without rankable comparisons do not enter the calculation. Equal-owner agreement is the arithmetic mean of these within-owner proportions (ALIQ Studio, 2026a; 2026b).
Equal-owner agreement was 52.3% in the original period, 71.4% in the later period and 64.2% combined. The combined figure pools each owner's rankable observations across both periods before averaging; it is not a simple average of the period results, and missing-period data are not imputed. For the earliest week per pair, equal-owner agreement was 67.5% (ALIQ Studio, 2026a). Weighting businesses equally therefore moved the original-period result close to a coin flip but did not lower the combined result much. The number of owner groups, their identities and each group's contribution remain restricted. The original protocol asked for a leave-one-owner-out agreement range as a concentration diagnostic; at the author's direction it is not published, which is a deviation from that protocol (ALIQ Studio, 2026b; 2026c). Together, these checks show why 67.2% should not be presented as a precise universal success rate.
4.2 Exposure, metadata and event-volume checks
| Check | Original period | Later period |
|---|---|---|
| Primary: RM30 and 1,000 impressions per ad | 27/41 (65.9%) | 14/20 (70.0%) |
| Lower floor: RM15 and 500 impressions | 60/85 (70.6%) | 25/38 (65.8%) |
| Higher floor: RM60 and 2,000 impressions | 8/15 (53.3%) | 5/5 (100.0%) |
| At least five reported conversations per ad | 12/18 (66.7%) | 5/5 (100.0%) |
| Exactly matching nonempty saved body/title text | 15/19 (78.9%) | 3/5 (60.0%) |
| Saved ad update predates the comparison window | 11/13 (84.6%) | 6/7 (85.7%) |
| Earliest eligible week per pair within each period | 12/22 (54.5%) | 7/11 (63.6%) |
Source: ALIQ Studio (2026a). The last row differs from Section 4.1: it resets the selection between periods and selects the earliest eligible week before removing unrankable results.
These restrictions select different comparison populations, and several are very small. The weakest original-period result is the higher exposure floor, 8/15. Matching saved text gives one of the strongest, 15/19, but does not control words inside images, every offer detail or historical changes. The later-period subsets of five to seven comparisons cannot carry a conclusion either way. None of these subsets replaces the primary result (ALIQ Studio, 2026a).
Across the primary comparisons, 49 of 122 ad-side observations contained fewer than five reported conversations; the median was 5.5. These observations repeat ads and dates and should not be interpreted as 122 independent ads. Modest result counts limit how confidently a business can interpret an individual cost difference (ALIQ Studio, 2026a).
4.3 Recorded cost differences vary in both directions
Of 63 qualifying pair/weeks, two both-zero comparisons were unrankable. Of the 61 rankable comparisons, 58 had positive reported conversations on both sides and entered the finite-ratio distribution; the three one-sided zero cases are described above. Across the 58 finite comparisons, median H/L was 0.727, with quartiles 0.518–1.079 and a range of 0.174–2.974 (ALIQ Studio, 2026a).
| Threshold t | H costs ≥t×L | L costs ≥t×H | Neither reaches t | Finite denominator |
|---|---|---|---|---|
| 1.10 | 13 | 38 | 7 | 58 |
| 1.25 | 10 | 34 | 14 | 58 |
| 1.50 | 6 | 24 | 28 | 58 |
| 2.00 | 3 | 13 | 42 | 58 |
Source: ALIQ Studio (2026a), exploratory magnitude results. H is the higher-CTR ad; L is its alternative. Each row partitions the same finite set.
At factor 1.25, ten comparisons favoured L and 34 favoured H. L costing 1.25 times H means H costs 20% less than L, not 25% less. The full comparison set includes favourable and unfavourable gaps for higher CTR. These dependent, selected observations are not estimates of recoverable savings or the effect of raising CTR (ALIQ Studio, 2026a).
4.4 Some cost orders depend on one recorded action unit
| View | Reversible orders / baseline rankable comparisons | Share |
|---|---|---|
| Original period | 15/41 | 36.6% |
| Later period | 4/20 | 20.0% |
| Combined primary | 19/61 | 31.1% |
| Earliest rankable week per pair across both periods | 16/30 | 53.3% |
| At least five reported conversations per ad | 6/23 | 26.1% |
| At least ten reported conversations per ad | 1/5 | 20.0% |
Source: ALIQ Studio (2026a), exploratory one-unit sensitivity. The union losing the original strict order equals the reversal count in each view.
No exact positive-cost tie was generated. Both-zero scenarios do not define two finite costs and are not counted as additional reversal cases. Earliest-pair selection is not reset between periods. A unit is a reported action amount, not necessarily a distinct person. These results do not imply misreporting or a future reversal probability. Outcome-selected volume subsets change the population and cannot establish a safe event-count threshold (ALIQ Studio, 2026a). Advertising-return precision research supplies no replacement threshold for this outcome (Lewis and Rao, 2015).
Most disagreements are fragile. Of the 20 disagreements, 12 could be reversed by one recorded conversation. Agreement was 34/42 (81.0%) among comparisons that one unit could not reverse, and 7/19 (36.8%) among those it could (ALIQ Studio, 2026c). The split is defined using the cost outcome, so it describes the archive rather than offering a rule: a comparison is robust partly because its cost gap is large, and large cost gaps are more likely when the CTR gap is large (Section 5).
The fragile comparisons are not spread evenly. The 30 earliest observations contain 16 of the 19 fragile comparisons, so the 31 later observations contain only three. The earliest-pair view therefore removes repetition and also concentrates the thinnest evidence. Its lower agreement (56.7%) can reflect either; the archive cannot separate the two. The two-week blocks in Section 7.3 offer a third view, with fewer repeats and more events per comparison: 21/31 agreement, with only 4/31 fragile.
4.5 Uncertainty under resampling of whole clusters
| View | Agreement | Resampling ad pairs | Resampling owner groups | Exact, pairs treated as independent |
|---|---|---|---|---|
| All weekly comparisons | 41/61 (67.2%) | 52.3–79.2% | 50.0–81.3% | not applicable |
| Earliest rankable week per pair | 17/30 (56.7%) | (one observation per pair) | 42.9–77.8% | 37.4–74.5% |
Source: ALIQ Studio (2026c). Percentile bootstrap, 20,000 replicates, fixed seed. A second seed and resampler gave 52.5–79.0% for the all-week pair-resampled interval.
Resampling ad pairs, 1.5% of replicates fell at or below 50% agreement; resampling owner groups, 2.9% did. These shares describe how the resampled estimates spread around the observed 67.2%; they are not probabilities that chance produced the result. The all-week intervals sit above 50%, but only just in the owner-resampled case, and pair resampling still ignores dependence between pairs that share an ad or an owner.
For the earliest week per pair, the exact binomial test against 50% gives p = 0.58 if the 30 pairs are treated as independent. That view therefore cannot be distinguished from a coin flip, which is not the same as showing that it is one. Neither interval for this view is reliable. The exact interval assumes independent pairs, which they are not. The owner-resampled interval rests on few owner groups, where percentile bootstrap intervals tend to be too narrow. If comparisons that share an ad or an owner tend to agree or disagree together, as seems likely, the true uncertainty is wider than both.
These intervals describe sampling variation among the observed pairs or owners under resampling. They are not margins of error for Malaysian advertisers, they do not account for how the archive was selected, and they do not make the post-hoc analyses confirmatory.
4.6 The size of the CTR gap matters
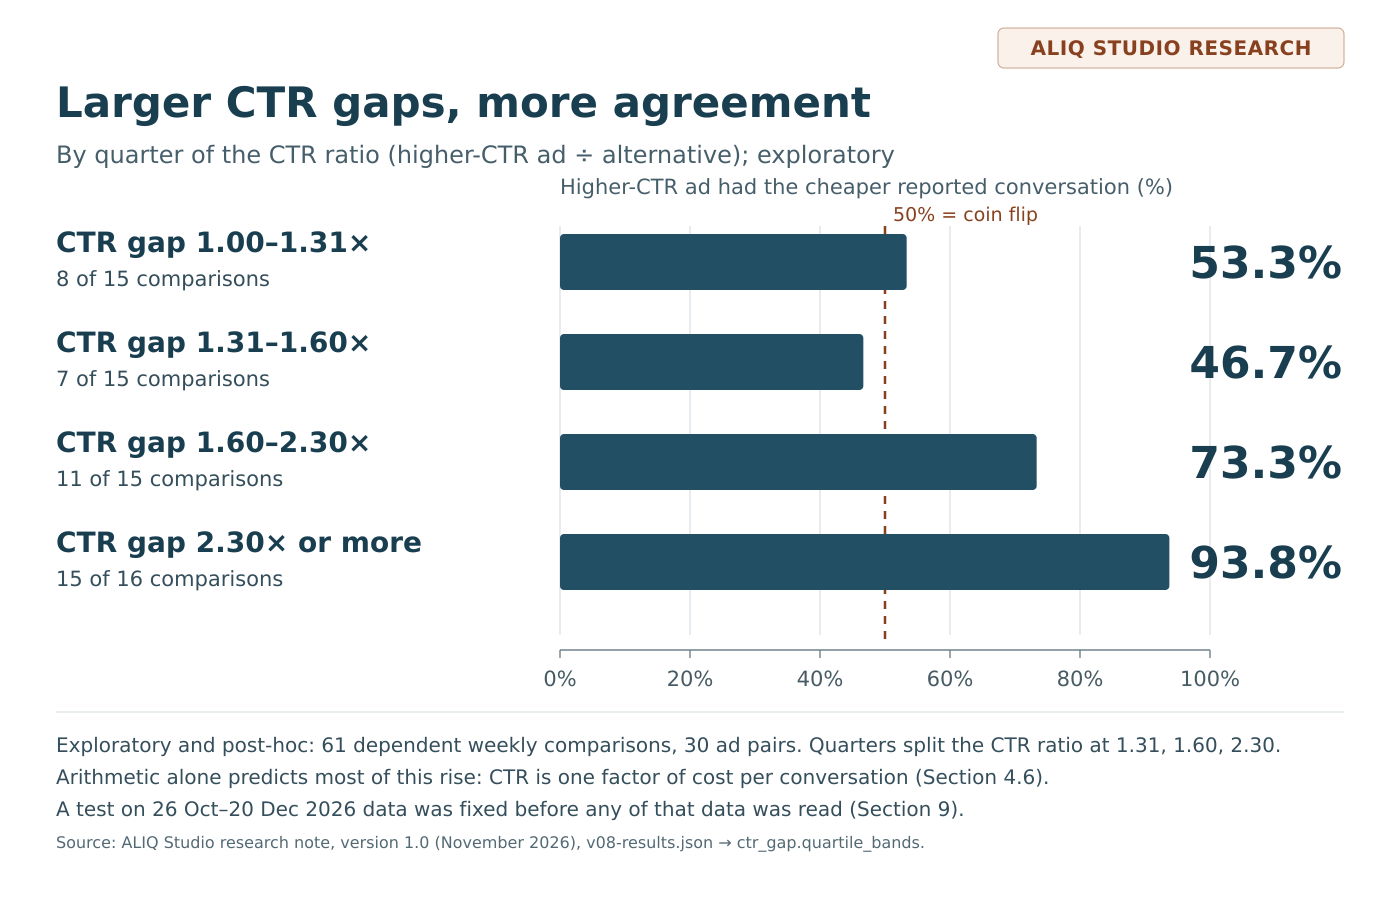
Figure 2. Agreement by size of the CTR gap (exploratory, post hoc). The 61 comparisons are grouped into quarters by the ratio of the higher CTR to the lower one, split at 1.31, 1.60 and 2.30. The higher-CTR ad had the cheaper reported conversation in 8/15 (53.3%) and 7/15 (46.7%) of the two lower quarters, and 11/15 (73.3%) and 15/16 (93.8%) of the two upper quarters. The dashed line marks 50%. Dependent comparisons from one selected archive. The rise is about what the arithmetic linking CTR to cost predicts on its own (see the benchmark below). Source: ALIQ Studio (2026c).
| View | CTR ratio below 1.5 | CTR ratio 1.5 or more |
|---|---|---|
| All weekly comparisons | 15/29 (51.7%) | 26/32 (81.3%) |
| Original period | 12/22 (54.5%) | 15/19 (78.9%) |
| Later period | 3/7 (42.9%) | 11/13 (84.6%) |
| Earliest rankable week per pair | 10/21 (47.6%) | 7/9 (77.8%) |
| Cut at the median ratio (1.60) instead | 15/30 (50.0%) | 26/31 (83.9%) |
| Cut at 1.3 instead | 8/15 (53.3%) | 33/46 (71.7%) |
| Cut at 1.4 instead | 12/23 (52.2%) | 29/38 (76.3%) |
| Cut at 1.75 instead | 19/34 (55.9%) | 22/27 (81.5%) |
| Cut at 2.0 instead | 23/40 (57.5%) | 18/21 (85.7%) |
Source: ALIQ Studio (2026c). 1.5 was a band boundary in the first exploratory run, set before any CTR-gap result was seen; making it the lead cut-point, and the other cut-points and the median split, came afterwards.
When the higher CTR was less than 1.5 times the lower one, it picked the cheaper reported conversation about as often as a coin flip. At 1.5 times or more, it did so in about four comparisons out of five. The difference, 29.5 percentage points, had a 95% interval of 6.3 to 48.6 points when ad pairs were resampled and 1.3 to 48.1 points when owner groups were resampled. The direction held in both study periods, at every cut-point examined, in the earliest-per-pair view, and when each owner group was removed in turn. The comparisons below 1.5 involve 23 distinct pairs and those at 1.5 or more involve 14; a pair can appear on both sides in different weeks.
Arithmetic alone predicts most of this pattern. Among the 58 finite comparisons, agreement was 13/27 (48.1%) below 1.5 and 26/31 (83.9%) at 1.5 or more, a gap of 35.7 points. When the other two factors were shuffled within each period (Section 3.5), the benchmark averaged 47.7% and 81.9%, a gap of 34.2 points, and 48.1% of shuffles produced a gap at least as large as the observed one. Shuffling across both periods gave a mean gap of 36.3 points, with 55.7% of shuffles at least as large (ALIQ Studio, 2026c). The pattern is therefore what one would expect if CTR were simply one factor of cost and the impression-cost and conversions-per-click ratios varied independently of the size of the CTR gap. It gives no sign that higher-CTR ads paid for larger CTR advantages with systematically worse impression costs or fewer conversations per click, and no sign of a link beyond the arithmetic. Shuffling treats comparisons as interchangeable, which dependent comparisons are not, so this is a benchmark rather than a formal test.
Four cautions apply. First, the analysis is post hoc: the 1.5 boundary was set before this result was seen, but after everything else in the study was known, and choosing it as the lead cut-point came later. Second, as the benchmark shows, the pattern describes how CTR enters the cost arithmetic. It is not evidence that ads with large CTR advantages differ in some further way. Third, the comparisons are dependent and few. Fourth, nothing here shows that an advertiser who acts on a large CTR gap will pay less in the following weeks (Section 7). Section 9 describes the test on later data that was fixed before that data was read.
5. Why higher CTR can coexist with higher conversation cost
The relevant arithmetic has three parts. Let R be reported conversations divided by recorded link clicks. For positive denominators:
Cost per reported conversation = CPM ÷ [10 × link CTR (%) × R].
For a higher-CTR ad H and its lower-CTR alternative L:
Cost ratio H/L = (CPM H/L) ÷ (CTR H/L) ÷ (R H/L).
These identities follow from the study's definitions. They do not require an assumed customer journey. R is a ratio of reported totals, not a measured probability that a particular click became a conversation. Meta counts WhatsApp conversations only when they start from clicks on the ad (Section 3.2), but we have no linked person-level click-to-chat records (ALIQ Studio, 2026b).
The post-hoc decomposition covers the disagreements with positive spend, impressions, link clicks and reported conversations on both sides: 19 of the 20 disagreements. The remaining one had no recorded conversations for the higher-CTR ad. In those 19, the higher-CTR ad had the higher CPM in 12, the lower R in 16, and both in 9. The larger adverse term on a logarithmic scale was R in 11 and CPM in 8. Median ratios (H/L) were 1.265 for cost, 1.150 for CPM, 1.367 for CTR and 0.708 for R (ALIQ Studio, 2026a).
In plain terms: in a typical disagreement the higher-CTR ad drew about 37% more link clicks per impression, but recorded about 29% fewer conversations per link click and paid about 15% more per thousand impressions. Its cost per reported conversation was a median 26.5% higher. These are medians of each ratio taken separately, so they do not multiply exactly. This describes a subset selected on the outcome; it is not recoverable savings or wasted spend, and it must not be converted into a proposed budget saving.
An adverse term in this decomposition partitions an observed cost difference algebraically; it is not evidence that the corresponding factor caused the difference. Selecting comparisons on disagreement also prevents treating a numerical term partition as an independent test of the relationship (ALIQ Studio, 2026a).
The decomposition cannot distinguish curiosity clicks, audience composition, offer differences, reply quality, measurement effects or random variation. It relates reported quantities algebraically without establishing why people behaved as they did. The same identity explains Section 4.6: when the CTR gap is small, modest differences in CPM or R can reverse the cost order; when it is large, they rarely did here.
A related operational decomposition appears in Biddyco (2026a), which also separates impression cost, CTR and a post-click ratio in selected US ads tracking purchases or leads. Shared algebra gives a useful vocabulary for reading the reported quantities, without making the samples or outcomes equivalent. The published abstract of Dalessandro et al. (2015) similarly motivates distinguishing a proxy from its target, while Ghose and Yang (2009) distinguish click/conversion indicators from profit. Those antecedents do not reveal which people messaged after clicking here. Section 6 therefore asks the narrower question of whether the recorded outcome totals reconcile.
6. What the missing-metric checks establish
The initial strict sensitivity required the named conversation action to appear explicitly on every shared date for both ads. Only one original-period comparison qualified, and it agreed; none qualified in the later period. This is too small to validate the primary relationship by itself (ALIQ Studio, 2026a).
The historical analysis therefore included a post-hoc read-only reporting reconciliation. It covered all 122 unique ad/calendar-week combinations underlying the 63 qualifying primary pair/weeks, including the two unrankable pairs. For each ad/week it compared archived daily totals, freshly returned daily totals and a freshly requested whole-week total. This check uses full calendar weeks; it is separate from the shared-date ranking calculation (ALIQ Studio, 2026a).
| Measure | Ad/weeks with identical totals across all three sources |
|---|---|
| Spend | 122/122 |
| Impressions | 122/122 |
| Recorded link clicks | 122/122 |
| Named reported-conversation action | 122/122 |
Source: ALIQ Studio (2026a), reporting reconciliation, read on 5 November 2026. A separate calculation path reproduced these equalities from the saved responses and original raw files.
Of these ad/weeks, 109 contained a historical returned action list without the named conversation action on at least one date; 18 contained an entirely absent action field on at least one date. Categories overlap. A separate deterministic sample of 12 absent-field ad-days, spaced across each period's eligible missing-field records, yielded 11 readable fresh responses. Each readable response reported delivery and no named conversation action; one was inaccessible (ALIQ Studio, 2026a).
These checks support the internal consistency of summing recorded events under the disclosed convention in the examined records. They do not establish that missing or suppressed events represent true zeros, validate the full platform definition, or independently verify inbox activity. Meta's help page now supplies a definition of the metric (Section 3.2), but not its rules for missing or suppressed values, and we do not attribute an unpublished zero-handling rule to Meta. Repeated agreement among extracts can coexist with a shared reporting limitation; consistency answers a narrower question than completeness.
As a further post-hoc sensitivity, treating an entirely absent actions field as zero recorded events produced agreement of 33/49 (67.3%) in the original period and 17/23 (73.9%) in the later period: 50/72 (69.4%) combined. This does not materially change the qualitative conclusion. The more conservative 41/61 primary result remains the headline because its rule was fixed before the primary calculation (ALIQ Studio, 2026a; 2026b).
7. The following-week check cannot choose a strategy
When CTR and conversation cost selected different ads in a training week, the protocol required both ads to continue delivering sufficient shared exposure in the following week. Only seven comparisons were evaluable. In four, the ad chosen by CTR was cheaper the following week; in three, the ad chosen by cost was (ALIQ Studio, 2026a).
Following-week screening flow
The screening rows below are sequential and mutually exclusive in their exclusions. Cells report comparisons retained, with exclusions at that stage in parentheses.
| Screening stage | Original period | Later period | Combined |
|---|---|---|---|
| Disagreement in the training week | 14 | 6 | 20 |
| Following week inside the study period | 13 (−1) | 5 (−1) | 18 (−2) |
| Both alternatives observed in the eligible following-week matching group | 9 (−4) | 4 (−1) | 13 (−5) |
| Sufficient shared exposure; evaluable following-week comparisons | 5 (−4) | 2 (−2) | 7 (−6) |
Source: following-week results and protocol (ALIQ Studio, 2026a; 2026b). No comparison reached a both-zero following-week outcome or an exact conversation-cost tie. Missing alternatives were not observed in the eligible following-week records and matching group; this does not establish that an advertiser stopped an ad.
A four-to-three split among seven dependent comparisons does not establish which rule predicts future performance better. Continuation and delivery are selected; alternatives that do not continue have no observed following-week outcome (ALIQ Studio, 2026a). The counterfactual allocation comparison described by Schwartz, Bradlow and Fader (2017) illustrates a different target and design. Our check supports no universal stopping threshold, fixed review interval or automated switching policy.
7.1 Extending follow-up to all training comparisons
The exploratory extension treats 5 January–25 October as one continuous interval while retaining each day's original eligibility and metadata provenance. Table 8 screens all 61 rankable training comparisons, including those where both prior rules chose the same ad. Its exclusions are sequential and mutually exclusive. Equal saved grouping fields do not establish stable historical targeting, offers or measurement (ALIQ Studio, 2026a; 2026b).
| Stage | All rankable training comparisons | Training disagreements only |
|---|---|---|
| Starting comparisons | 61 | 20 |
| Excluded: following week outside combined interval | 2 | 1 |
| Excluded next: one/both alternatives absent from eligible matching group | 9 | 5 |
| Excluded next: fewer than three shared positive-impression dates | 7 | 3 |
| Excluded next: below spend or impression floor | 19 | 4 |
| Excluded next: both-zero follow-up | 1 | 0 |
| Excluded next: exact follow-up cost tie | 0 | 0 |
| Evaluable comparisons | 23 | 7 |
Source: ALIQ Studio (2026a), exploratory following-week screening.
The 23 evaluable transitions contain 12 distinct ad pairs and are dependent. The previously cheaper ad remained cheaper in 17/23.
| Training week | Following week: H cheaper | Following week: L cheaper |
|---|---|---|
| H cheaper (CTR and cost chose the same ad) | 14 | 2 |
| L cheaper (CTR and cost disagreed) | 4 | 3 |
Source: ALIQ Studio (2026a), exploratory following-week results.
Only the bottom row distinguishes the two rules: CTR chose H, cost chose L, and the following week split four to three. The top row shows that when both rules agreed, their choice stayed cheaper in 14 of 16 transitions; it cannot say which rule to prefer when they differ.
A follow-up may cross a source-period boundary under the combined-interval rule if the matching, shared-date and exposure requirements are met. Persistence among selected continuing alternatives does not establish an optimisation benefit or a policy winner (ALIQ Studio, 2026a).
7.2 Removing reused pair/weeks before follow-up screening
The outcome-agnostic greedy rule selected 43 training candidates before inspecting follow-up availability or outcomes. Screening excluded six with missing alternatives, four with insufficient shared dates, 15 below the exposure floors and one both-zero outcome, leaving 17 evaluable transitions involving 12 distinct pairs. The previously cheaper ad remained cheaper in 12/17. Six training disagreements distinguished the rules and split three to three. Failed candidates reserved their weeks and were not replaced. Other pairs can still share ads or owners; nonoverlap reduces one form of reuse without removing dependence or continuation selection (ALIQ Studio, 2026a; Aronow, Samii and Assenova, 2015; Cameron and Miller, 2015). The reservation rule also separates candidate construction from observed follow-up success: failed candidates cannot be replaced by easier-to-observe transitions. It does not make continuing ads a random sample of all alternatives.
7.3 Longer windows change the included comparisons
Table 10 compares the weekly baseline with complete anchored two- and four-week blocks under the scaled exposure floors. The incomplete final four-week block excluded 256 retained daily records by calendar rather than outcome. One qualifying four-week comparison crossed the source-period boundary (ALIQ Studio, 2026a; 2026b).
| View | Rankable comparisons | Distinct ad pairs | CTR/cost agreement | One-unit loss of strict order |
|---|---|---|---|---|
| Weekly primary | 61 | 30 | 41/61 (67.2%) | 19/61 (31.1%) |
| Two-week blocks, all eligible | 31 | 20 | 21/31 (67.7%) | 4/31 (12.9%) |
| Two-week blocks, original-pair restriction | 30 | 19 | 21/30 (70.0%) | 3/30 (10.0%) |
| Four-week blocks, all eligible and original-pair restriction | 10 | 8 | 8/10 (80.0%) | 0/10 (0.0%) |
Source: ALIQ Studio (2026a), exploratory aggregation sensitivity. Original-pair restriction uses the 30 pairs in the weekly primary analysis.
Two-week selection retained 31 of 460 candidates after 350 shared-date and 79 exposure exclusions; four-week selection retained ten of 344 after 307 and 27 respectively. No additional both-zero or tie exclusions occurred. Even the pair restriction retains only 19 and eight of the 30 baseline pairs at two and four weeks. Longer windows sharply reduced one-unit fragility while agreement stayed at 67.7–80.0%. Different included populations and limited support still prevent concluding that waiting improves decisions (ALIQ Studio, 2026a; 2026b).
Longer aggregation thus answers the question for the pairs that survive its own complete-window and exposure requirements. It does not observe the same weekly decisions after a randomly assigned delay. Retaining baseline pair identities narrows one difference in composition while leaving substantial attrition, dependence and selected delivery. These distinctions lead to reporting questions for practitioners, rather than a prescribed period to wait.
8. Implications for advertisers and agencies
For a messaging campaign, read reported outcome cost alongside CTR, the size of each gap and the number of reported conversations supporting it. Four readings follow from this archive. Each describes same-week comparisons, is limited by selection and dependence, and is not a tested decision rule.
- A small CTR gap said little here. When one ad's link CTR was less than 1.5 times the other's, it had the cheaper reported conversation about half the time (15/29), much as a coin flip would.
- A large CTR gap usually went with the cheaper conversation. At 1.5 times or more, the higher-CTR ad was cheaper in 26/32 comparisons. That is about what the arithmetic predicts when CTR is one factor of cost (Section 4.6). It is exploratory and awaits the test in Section 9.
- Check how many conversations sit behind a cost order. With a median of 5.5 reported conversations per ad-week, 12 of the 20 disagreements could be reversed by one conversation. A weekly cost order resting on a handful of events is weak evidence on its own.
- No switching rule is established. In the following week, CTR-based and cost-based choices split four to three (Section 7). Neither rule can be recommended over the other from this archive.
Where the two measures disagree, the identity in Section 5 suggests inspecting impression cost and the conversations-to-clicks quotient, while checking the offer and reporting coverage. These are diagnostic questions derived from the observed arithmetic, rather than evidence that changing one quantity will improve another (Biddyco, 2026a). The literature offers both divergence and alignment across different targets (Dalessandro et al., 2015; Yang and Ghose, 2010; Hotkar, Garg and Sussman, 2023). That mixed context supports reading the metrics together, while objective-specific benchmarks and grouped local indices remain contextual comparisons rather than imported selection targets (Marino, 2026; Lee, 2026).
For buyers, the distinction is between recorded clicks, reported messaging actions and actual customer outcomes. The first two are aggregate measures in this dataset; they do not link individual journeys or measure purchases or customers. Enquiry quality, bookings, revenue and profit require downstream records (ALIQ Studio, 2026b). A buyer can ask how large the CTR gap is, how many reported actions support the cost order, how large the cost gap is in both ratio directions, what missingness convention was used, and whether comparable alternatives remained observable next week.
9. The next test
The CTR-gap pattern in Section 4.6 was found by looking at data that had already been analysed in other ways. To test it, a plan was fixed on 8 November 2026, before any advertising data dated after 25 October 2026 had been read for this study (ALIQ Studio, 2026c). Its main terms are:
- Data. Complete weeks from 26 October to 20 December 2026, pulled read-only no earlier than 3 January 2027, under the unchanged eligibility, matching and metric rules. If fewer than 30 pair/weeks qualify on exposure alone, the window extends in four-week steps, to 14 February 2027 at most. That count is made before any CTR or cost figure is computed.
- Estimand. Agreement among comparisons with a CTR ratio of 1.5 or more, minus agreement among those below 1.5, in the test window only, never pooled with the January–October data.
- Uncertainty. A percentile bootstrap resampling whole ad pairs, 20,000 replicates, with a seed fixed in advance.
- Verdict, fixed in advance and applied in order. Inconclusive if either group has fewer than eight rankable comparisons or five distinct ad pairs, or if more than 1% of bootstrap replicates lack one of the groups. Otherwise supported if the interval's lower bound is above zero, contradicted if its upper bound is below zero, and inconclusive if it spans zero. This replaced a first version of the rule, the same day and before any test data was read, after a review found that its verdicts could overlap and that it treated a negative estimate as a contradiction regardless of uncertainty.
- Also reported, whatever they show. Agreement in the 1.5-or-more group alone; the earliest week per pair; pairs not among the original 30; an owner-resampled interval; and the one-unit robustness split.
The later 2026 period produced only 20 rankable comparisons in eight weeks, so an inconclusive result is a real possibility. The plan's text and its cryptographic hash are kept in the study record. It has not been registered with an external registry. We intend to run the test in January 2027, once the reported data has settled, and to publish the result as an update to this note, whatever it shows.
10. Limitations and disclosure
The archive is selected and access-dependent, without a probability sample of advertisers, verified national SME frame or population error margin. Matching does not randomise exposure, audiences, offers or spend, and saved object snapshots may miss historical targeting, destination or creative changes. The later-period study followed knowledge of the original result; subsequent repetition, arithmetic, reconciliation, magnitude, temporal and final-stage analyses are exploratory, even where their specifications were frozen before the outcomes were calculated. The final-stage analyses were specified after preliminary versions had been run. No external preregistration or completed independent peer review is claimed (ALIQ Studio, 2026a; 2026b; 2026c).
Sparse action counts, repeated dates and overlapping ad pairs constrain interpretation. The clustered intervals in Section 4.5 address sampling variation among the observed pairs or owner groups only; with few owner groups they are likely to be too narrow, and they cannot correct for how the archive was selected. Keeping one observation per pair or preventing reuse of identical pair/weeks does not remove all shared-ad or owner dependence (Cameron and Miller, 2015; Aronow, Samii and Assenova, 2015). One-unit stress holds spend and delivery fixed and estimates no sampling uncertainty, reporting-error frequency or future reversal probability. Outcome-volume restrictions and longer windows select different populations; absent follow-up alternatives leave their counterfactual outcomes unobserved. The small policy-informative subsets establish no universal event threshold, waiting interval or selection-policy winner (ALIQ Studio, 2026a).
The CTR-gap result in Section 4.6 is the analysis most likely to be overstated. It was found after the data had been examined in other ways, a benchmark shows it is about what the arithmetic linking CTR to cost predicts on its own, and it rests on 61 dependent comparisons. It should be read as a hypothesis with a fixed test (Section 9), not as an established finding.
Reporting reconciliation establishes agreement among examined extracts, rather than true zeros or independently verified inbox activity. The outcome does not measure unique customers, qualified enquiries, sales or profit, and observed gaps are not savings estimates (ALIQ Studio, 2026b). Meta's metric definitions were read from its current public help pages on 8 November 2026; they are not the API field documentation and may differ from the definitions in force on earlier dates (Meta, 2026a; 2026b). Six journal sources are cited from their published abstracts only, as noted in the references.
Separate implementations rebuilt the study's eligibility and pair enumeration from manifest-pinned raw extracts without importing the original analysis module. They reproduced 41/61, 17/30, 58 finite ratios, 19 primary one-unit reversals and the 16/30 earliest-pair reversal check. For the final-stage analyses, a second calculation path re-enumerated every candidate pair from the retained eligible daily records, recovered exactly the 63 qualifying comparisons, and reproduced their counts in Sections 4.4–4.6. A separate review re-derived the same population and the new counts independently and found no discrepancy. These checks do not independently establish historical management, ownership, targeting or creative content. The selected public code alone does not reconstruct the restricted raw-input cohort.
Data availability. The supporting-data index provides selected anonymised aggregates, methods, calculation code and figures. Results of the final-stage analyses are in v08-results.json and v08-arithmetic-null.json; earlier pooled results are in pooled-results.json, and the other aggregate cells reported here are in restored-cells.json. Identifiable raw records, private associations, the number of client businesses and individual-client performance remain restricted; no open licence or permission for further access is asserted. The selected public materials alone do not reconstruct the private cohort. Corporate attribution identifies research-record custody, rather than author or reviewer approval. No ads were changed and no new advertising spend was used for this research.
Ethics and permissions. The author confirms that client advertising records may be used subject to anonymisation and that the contractual and platform publication checks were completed for an earlier draft's anonymous aggregate use on 6 November 2026. This version reports further anonymous aggregate counts from the same records, and the same checks were confirmed for it on 9 November 2026. These statements do not extend permission to identifiable cases or restricted raw records. No institutional approval or exemption, official platform approval or independent legal certification is asserted.
Author contributions. Ooi Yik Jinn is the sole author and confirms responsibility for study design, data access and curation, software and analysis, visualisation, writing and revision, and project administration. The internal review by Wong Wai Kee is acknowledged separately and does not assign authorship.
Conflicts of interest. ALIQ Studio sells advertising and marketing services and has a commercial interest in the topic. The earlier ALIQ benchmark and this study share custody (Ooi, 2026). Beyond the disclosed ALIQ affiliation and internal-resource funding, the author declares no additional relevant financial or commercial interests.
Funding. This research was supported by ALIQ internal resources. No external funding was received.
Review. Wong Wai Kee, co-founder and CEO, reviewed this note. He completed a full internal review of an earlier draft on 6 November 2026, covering numerical verification and the contractual and platform publication checks for the anonymous aggregate use, and checked this version on 9 November 2026. AI tools assisted with coding and data analysis, under the author's direction.
References
ALIQ Studio (2026a) Does a higher click-through rate mean a cheaper conversation? Version 0.3. Unpublished working manuscript and aggregate results, 5 November. Restricted study documentation.
ALIQ Studio (2026b) Clicks and conversations: retrospective protocols and exploratory diagnostic specification. Unpublished study specification bundle, 5 November. Restricted study documentation.
ALIQ Studio (2026c) Clicks and conversations: version 0.8 analysis record and CTR-gap test plan. Unpublished specification, code, results and frozen test plan, 8 November. Restricted study documentation; aggregate results in the supporting material.
Aronow, P.M., Samii, C. and Assenova, V.A. (2015) 'Cluster–robust variance estimation for dyadic data', Political Analysis, 23(4), pp. 564–577. Available at: https://doi.org/10.1093/pan/mpv018.
Biddyco (2026a) 'What actually predicts cost per purchase on Meta? (2026 data)'. Available at: https://www.biddyco.com/blog-posts/what-predicts-cost-per-purchase-meta (Accessed: 6 November 2026).
Biddyco (2026b) 'What's a good CTR for Facebook ads? 2026 benchmarks from $26M in spend'. Available at: https://www.biddyco.com/blog-posts/facebook-ads-ctr-benchmarks (Accessed: 6 November 2026).
Cameron, A.C. and Miller, D.L. (2015) 'A practitioner's guide to cluster-robust inference', Journal of Human Resources, 50(2), pp. 317–372. Available at: https://doi.org/10.3368/jhr.50.2.317.
Dalessandro, B., Hook, R., Perlich, C. and Provost, F. (2015) 'Evaluating and optimizing online advertising: Forget the click, but there are good proxies', Big Data, 3(2), pp. 90–102. Available at: https://doi.org/10.1089/big.2015.0006. Cited from the published abstract only.
Ghose, A. and Yang, S. (2009) 'An empirical analysis of search engine advertising: Sponsored search in electronic markets', Management Science, 55(10), pp. 1605–1622. Available at: https://doi.org/10.1287/mnsc.1090.1054. Cited from the published abstract only.
Gordon, B.R., Zettelmeyer, F., Bhargava, N. and Chapsky, D. (2019) 'A comparison of approaches to advertising measurement: Evidence from big field experiments at Facebook', Marketing Science, 38(2), pp. 193–225. Available at: https://doi.org/10.1287/mksc.2018.1135. Cited from the published abstract only.
Hotkar, P., Garg, R. and Sussman, K. (2023) 'Strategic social media marketing: An empirical analysis of sequential advertising', Production and Operations Management, 32(12), pp. 4005–4020. Available at: https://doi.org/10.1111/poms.14075.
Lee, J.T. (2026) 'Meta ads Malaysia for Thai brands: targeting & creative tips'. Zenweb. Available at: https://zenweb.my/blog/meta-ads-malaysia-thai-brands/ (Accessed: 6 November 2026).
Lewis, R.A. and Rao, J.M. (2015) 'The unfavorable economics of measuring the returns to advertising', The Quarterly Journal of Economics, 130(4), pp. 1941–1973. Available at: https://doi.org/10.1093/qje/qjv023.
Lewis, R.A. and Reiley, D.H. (2014) 'Online ads and offline sales: Measuring the effect of retail advertising via a controlled experiment on Yahoo!', Quantitative Marketing and Economics, 12(3), pp. 235–266. Available at: https://doi.org/10.1007/s11129-014-9146-6. Cited from the published abstract only.
Marino, S. (2026) 'Facebook ads benchmarks 2026: new data, trends, & insights for your industry'. WordStream. Available at: https://www.wordstream.com/blog/facebook-ads-benchmarks-2026 (Accessed: 6 November 2026).
Meta (2026a) 'Messaging conversation started'. Meta Business Help Centre. Available at: https://www.facebook.com/business/help/2038363993156008 (Accessed: 8 November 2026).
Meta (2026b) 'Link clicks'. Meta Business Help Centre. Available at: https://www.facebook.com/business/help/659185130844708 (Accessed: 8 November 2026).
Neundorf, A. and Öztürk, A. (2023) 'How to improve representativeness and cost-effectiveness in samples recruited through meta: A comparison of advertisement tools', PLOS ONE, 18(2), e0281243. Available at: https://doi.org/10.1371/journal.pone.0281243.
Ooi, Y.J. (2026) 'Facebook ads cost in Malaysia: RM13.43 per conversation (August 2026 data)'. ALIQ Studio. Available at: https://studio.aliqgroup.com/en/blog/facebook-ads-cost-malaysia/ (Accessed: 6 November 2026).
Schwartz, E.M., Bradlow, E.T. and Fader, P.S. (2017) 'Customer acquisition via display advertising using multi-armed bandit experiments', Marketing Science, 36(4), pp. 500–522. Available at: https://doi.org/10.1287/mksc.2016.1023. Cited from the published abstract only.
Yang, S. and Ghose, A. (2010) 'Analyzing the relationship between organic and sponsored search advertising: Positive, negative, or zero interdependence?', Marketing Science, 29(4), pp. 602–623. Available at: https://doi.org/10.1287/mksc.1090.0552. Cited from the published abstract only.
Citation and reuse
How to cite this paper
Ooi Yik Jinn, ALIQ Studio (2026). Does a higher click-through rate mean a cheaper conversation? v1.0. https://studio.aliqgroup.com/en/research/ctr-conversation-cost-malaysia-2026/. CC BY 4.0.
Licence and reuse
This paper and its selected public supporting material are published under the Creative Commons Attribution 4.0 International licence (CC BY 4.0). You may copy, share, quote, adapt and build on them for any purpose, including commercially, as long as you give appropriate credit, link to the licence and say if you changed anything, without suggesting that ALIQ Studio endorses you or your use. The licence does not cover the restricted records described in Section 10, and quotations from other publishers remain under their owners' terms. Suggested credit: as in How to cite this paper, above.